A Guide to Major Types of Tap Wear and Quantitative Analysis
Four Typical Types of Tap Wear
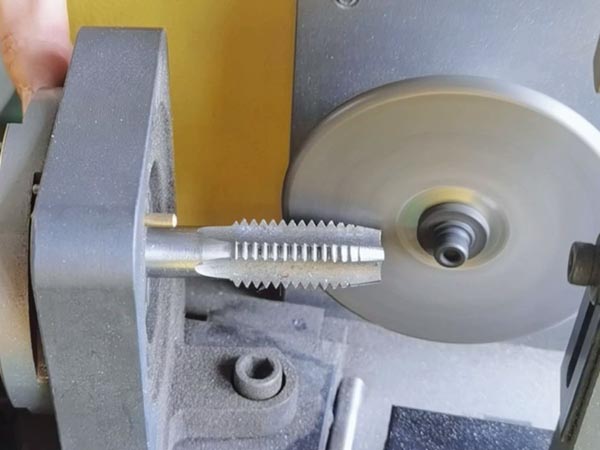
Flank Wear
- Mechanism: Continuous friction between the tap’s flank face and the machined hole wall causes material loss in the land area.
- Characteristics: Uniform wear band along the cutting edge; most common in HSS (High-Speed Steel) taps.
- Quantitative Criteria:
- Mild Wear: Wear band width < 0.05 mm (monitor condition)
- Moderate Wear: 0.05–0.15 mm (adjust machining parameters)
- Severe Wear: > 0.15 mm (replace immediately)
Crater Wear (on the Rake Face)
- Mechanism: High-temperature chips rub against the rake face during cutting, forming a crescent-shaped pit.
- Typical Conditions: Common when machining sticky materials such as stainless steel or high-temperature alloys.
- Quantification Methods:
- Depth Measurement: Use a profilometer to measure pit depth (threshold: 0.02 mm)
- Area Ratio: If crater area > 30% of the rake face, tap should be scrapped
Edge Chipping
- Mechanism: Intermittent cutting or hard inclusions in the workpiece cause localized fracture at the cutting edge.
- Risk Levels:
- Micro-Chipping (< 0.1 mm): Usable with monitoring
- Macro-Chipping (> 0.3 mm): Stop machining and replace immediately
- Inspection Tool: 20x magnifier or portable microscope
Adhesion Wear
- Mechanism: Workpiece material welds to the tap under high temperature and pressure, then tears away, damaging the surface.
- Common Materials: Low-melting-point metals like aluminum alloys or pure copper.
- Quantitative Indicators:
- Adhesion Area: >5% of surface area (measured under metallographic microscope)
- Surface Roughness: Ra > 1.6 μm in adhesive regions indicates precision loss
Quantitative Analysis Methods for Wear
Direct Measurement Method
- Tools: Digital micrometer, optical microscope (50–200x)
- Procedure:
- Clean the tap and fix it on the measurement platform
- Focus on the most worn flank region
- Measure the wear band width using a scale (accuracy ±0.002 mm)
- Application: Build a wear progression curve (Figure 1) to predict remaining tool life
Indirect Monitoring Methods
- Torque Analysis:
- Install a wireless torque sensor to record torque fluctuations during tapping
- Wear of 0.1 mm typically corresponds to a 15–20% torque increase (Figure 2)
- Vibration Spectrum Analysis:
- Worn taps show 3–5x increase in vibration amplitude within the 500–800 Hz band
Microscopic Morphology Analysis
- SEM (Scanning Electron Microscope):
- Observe micro-crack propagation at the cutting edge (cracks > 50 μm indicate danger)
- EDS (Energy Dispersive Spectroscopy):
- Analyze bonded material on the rake face to determine the extent of material transfer
Correlation Between Wear Types and Machining Defects
| Wear Type | Typical Hole Deviation | Surface Roughness Impact | Recommended Priority |
|---|
| Flank Wear | +0.05~0.15 mm | Ra increases by 0.4–0.8 μm | ★★★☆☆ |
| Crater Wear | +0.10~0.20 mm | Ra increases by 1.2–2.0 μm | ★★★★☆ |
| Edge Chipping | ±0.15 mm | Ra > 3.2 μm | ★★★★★ |
| Adhesion Wear | +0.08~0.12 mm | Ra fluctuates >50% | ★★★★☆ |
Quantitative Wear Management Strategy for Factory Use
Tiered Warning System
- Green Status: Wear < 50% of threshold, normal use
- Yellow Alert: Wear 50–80%, reduce inspection interval to every 50 holes
- Red Alarm: Wear > 80%, mandatory tool change and cause analysis
Digital Tool Recordkeeping
- Create a QR code record for each tap, documenting:
- Total number of holes machined
- Historical peak torque
- Most recent wear measurement
- Use big data analytics to optimize tool change strategy
Economic Balance Model
- Formula for Maximum Allowable Wear (Lmax):
Lmax = Ct / (Cp × Nf + Cd)
Where:
- Ct: Tap cost
- Cp: Profit per hole
- Nf: Number of holes before failure
- Cd: Cost of rework for out-of-tolerance parts
Case Study
Scenario: Tapping GCr15 steel (HRC58–62) at a bearing manufacturer
- Problem: M6×1 tap lasts only 15 holes, hole oversize +0.1 mm
- Findings:
- Flank wear: 0.12 mm (exceeded by 60%)
- Crater depth: 0.03 mm
- Three chipped edges, max size 0.25 mm
- Improvements:
- Switched to carbide tap (K20 grade)
- Increased spindle speed to 350 rpm (reduces cutting force)
- Adopted liquid nitrogen cooling (-50°C)
- Results:
- Tap life extended to 120 holes
- Hole tolerance fluctuation within ±0.02 mm
Conclusion
Scientific management of tap wear requires both type recognition and quantitative analysis. By regularly monitoring key parameters such as flank wear width and crater depth, over 70% of hole oversize issues can be predicted in advance. It is recommended that enterprises implement a three-tier inspection system (operator visual → QC instrument → lab microanalysis) and use torque-to-wear correlation models to optimize tool replacement strategies. This approach can reduce machining costs by over 20% and stabilize dimensional pass rates above 95%.

 We like to do design according to all the customers' requirements, or offer them our new designs. With strong OEM/ODM capabilities, we can fill your sourcing demands.